Renewable project screening
Compare candidate areas with grid capacity, curtailment, nearby assets, and permitting context before progressing sites.
eRoots Map is a digital twin of the Iberian power grid built for teams that need to evaluate assets, connection capacity, curtailment exposure, market signals, and permitting context in one geospatial workspace.
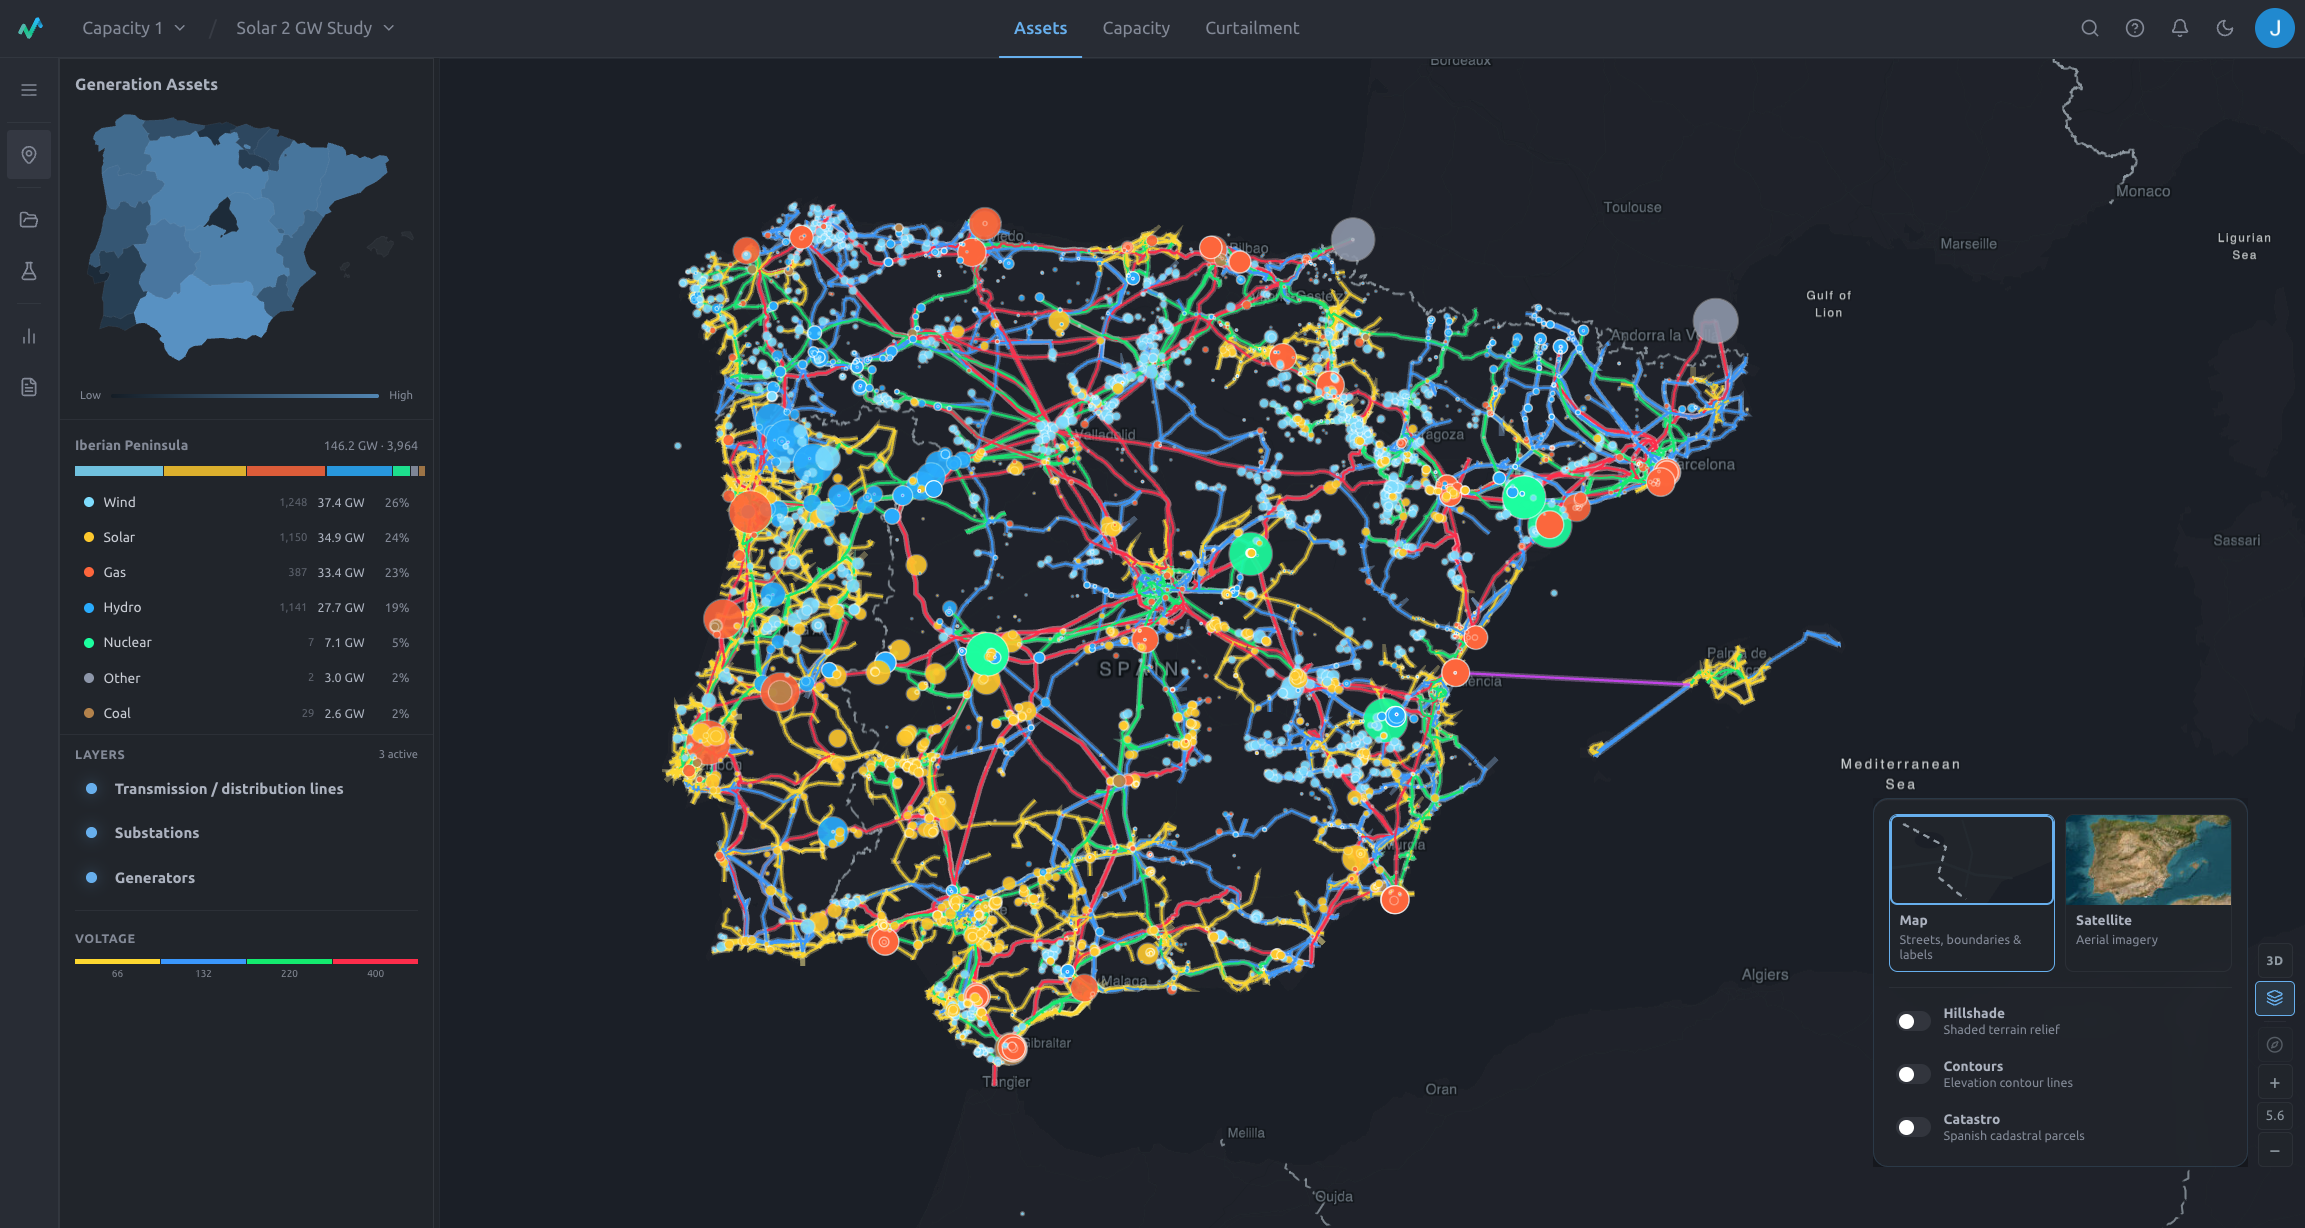
Move from fragmented public datasets and static spreadsheets to an interactive map where technical, market, and permitting context can be reviewed together.
eRoots Map brings grid infrastructure, generation assets, substations, transmission lines, load areas, market data, curtailment signals, and permitting records into one spatial interface. Teams can start from the map, search for a known asset, inspect electrical details, and move from regional screening to local site context without changing tools.
Compare candidate areas with grid capacity, curtailment, nearby assets, and permitting context before progressing sites.
Identify places where capacity, curtailment, generation mix, and network context may support storage or hybrid project strategies.
Evaluate technical and market risk across regions, assets, substations, and official project milestones.
Review nearby grid infrastructure, load areas, substations, and transmission context when screening energy-intensive locations.
Early-stage energy decisions are often made with incomplete spatial context: capacity indicators in one place, curtailment signals in another, permitting evidence in PDFs, and asset data in separate spreadsheets. eRoots Map reduces that friction by putting the relevant grid context on the same map.
Compare regions, substations, lines, generation clusters, and nearby load context before committing engineering time.
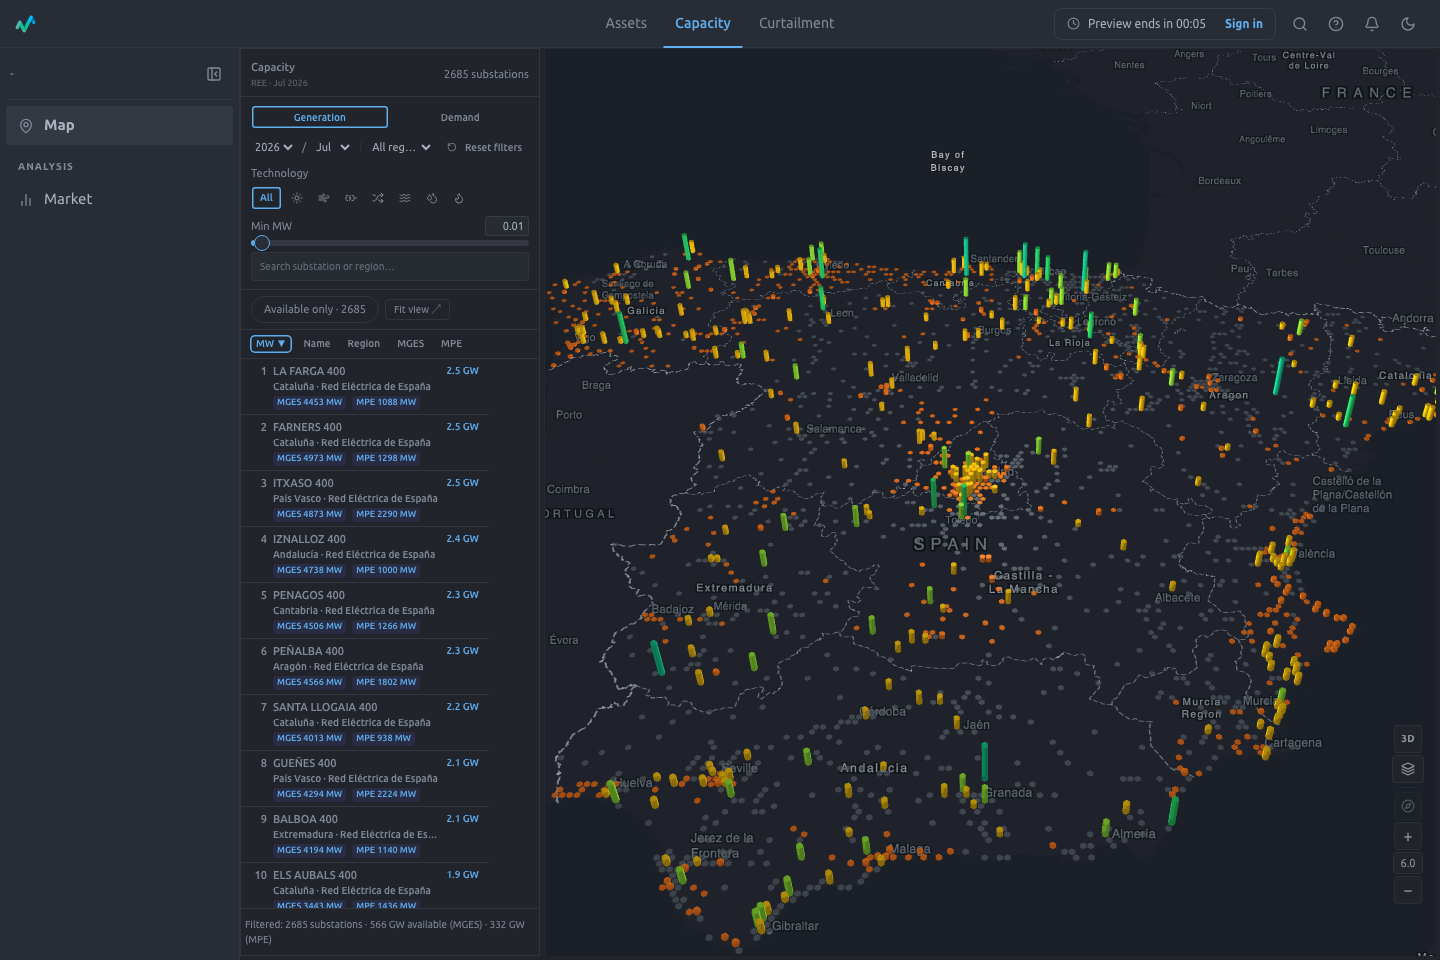
Review connection capacity and curtailment exposure together instead of treating them as separate questions.
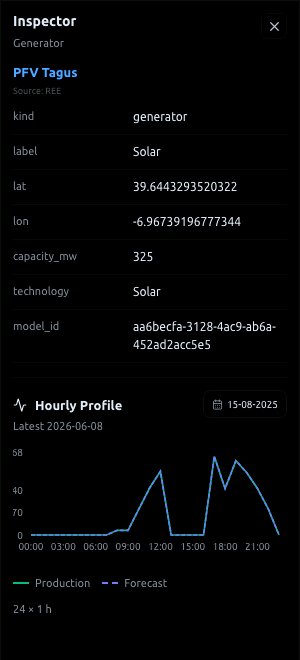
Select assets, substations, lines, cadastral parcels, market units, and bulletin records to review the details behind each location.
Give development, finance, engineering, and strategy teams a shared visual workspace for project decisions.
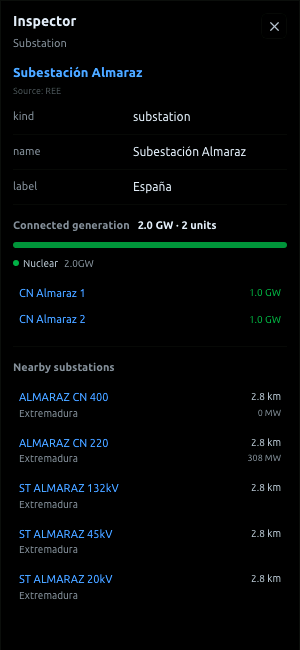
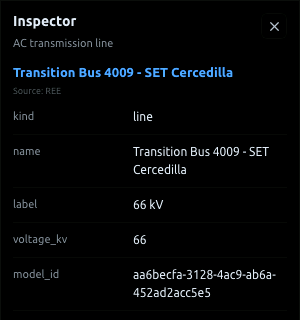
Assets View is the starting point for exploring the digital twin. Users can search for generation assets, substations, transmission or distribution lines, and cadastral parcels. Selecting an item opens an inspector with the relevant electrical and contextual details.
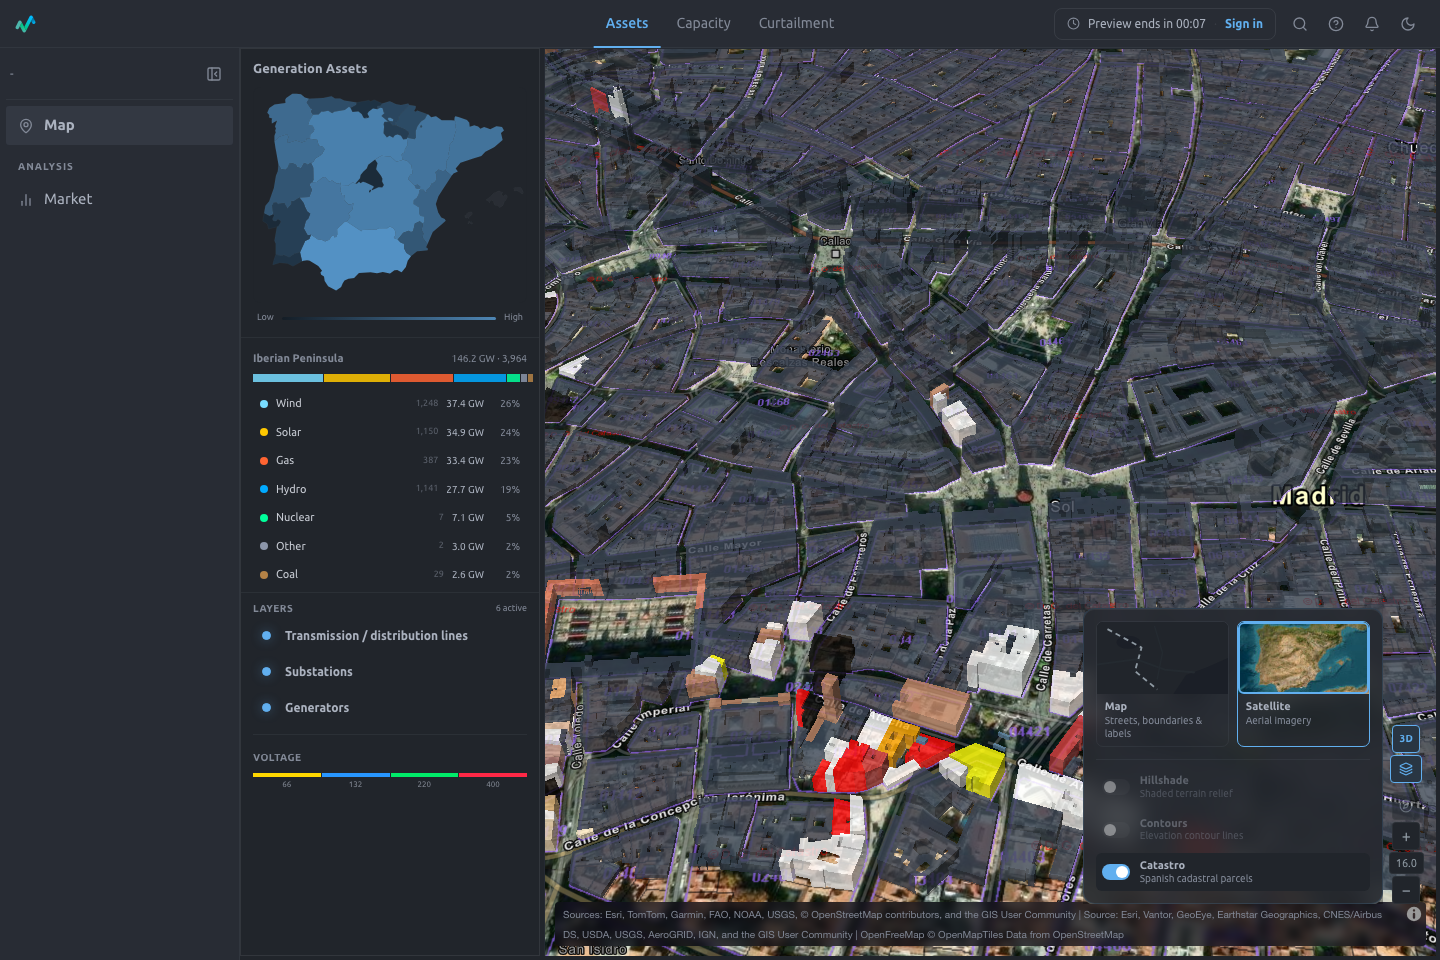
Satellite, 3D, and Catastro layers let teams review the same candidate area from infrastructure, terrain, and cadastral perspectives without leaving the workflow.
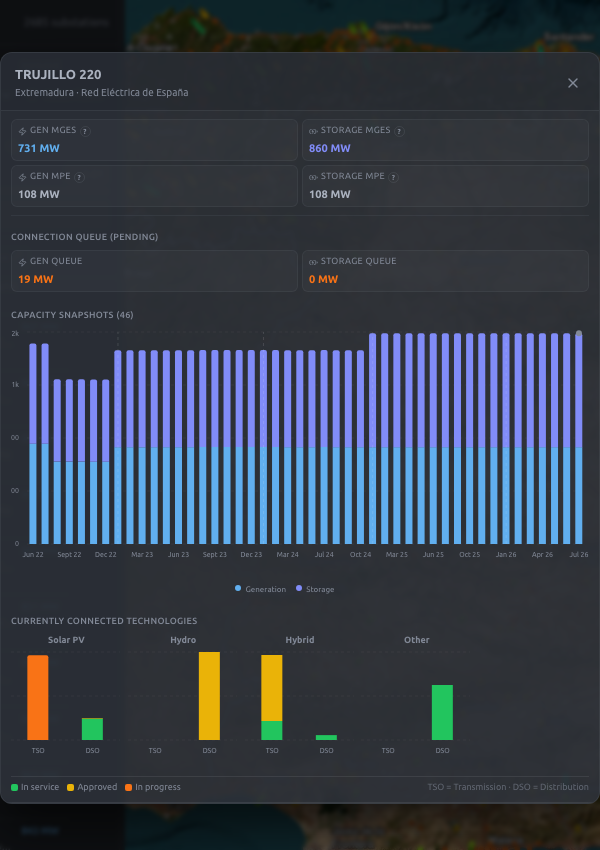
Capacity View helps users understand where connection opportunities are likely to be stronger or weaker. Capacity results are shown on the map and in ranked panels so teams can move between regional patterns and substation-level detail.
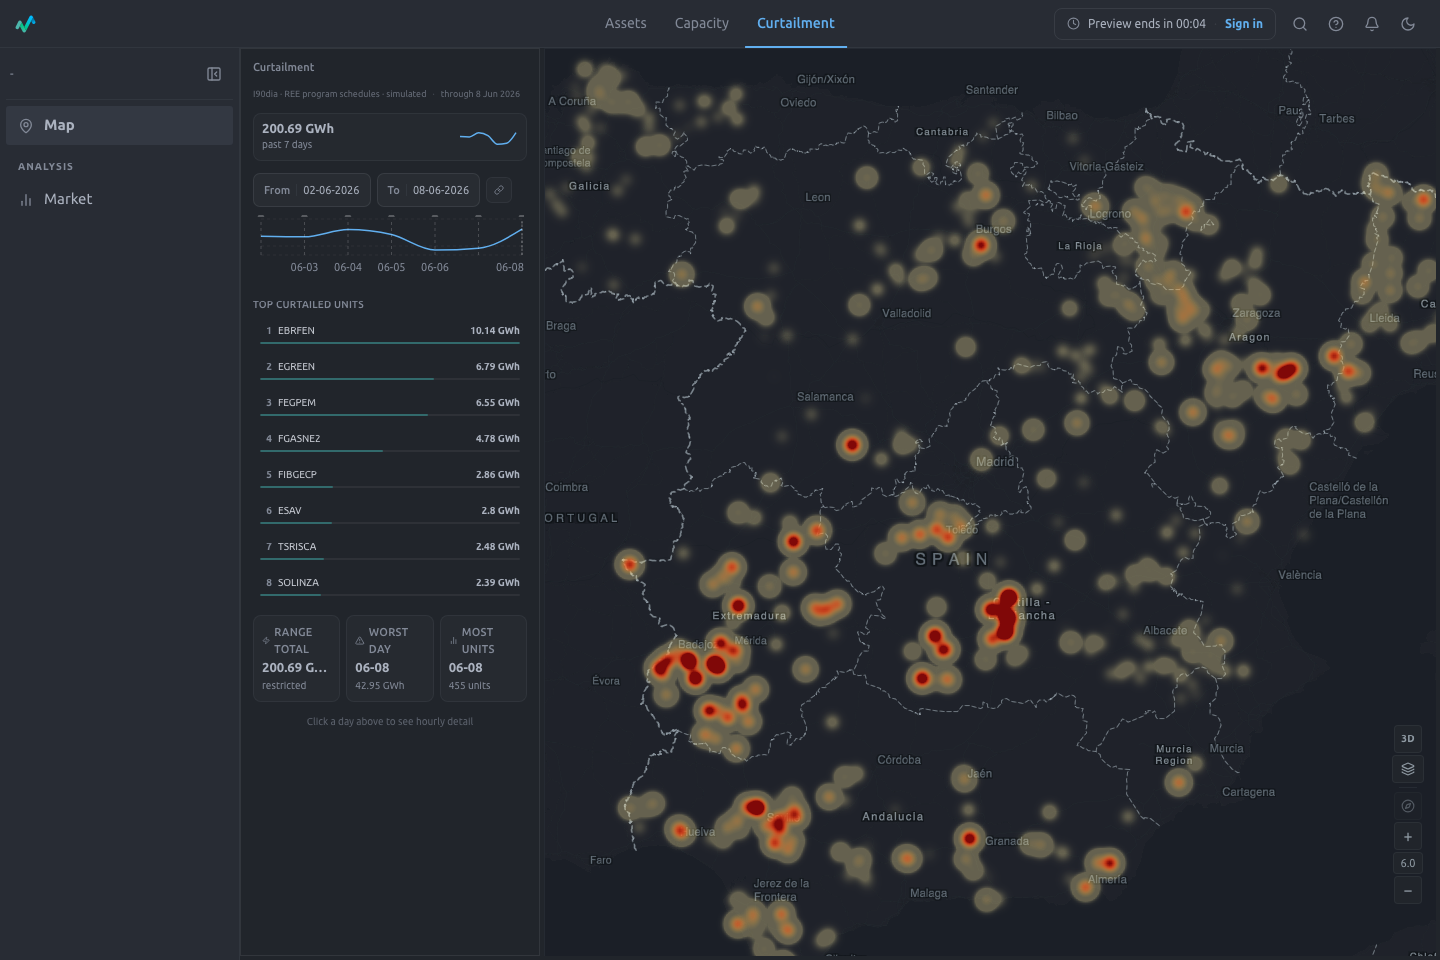
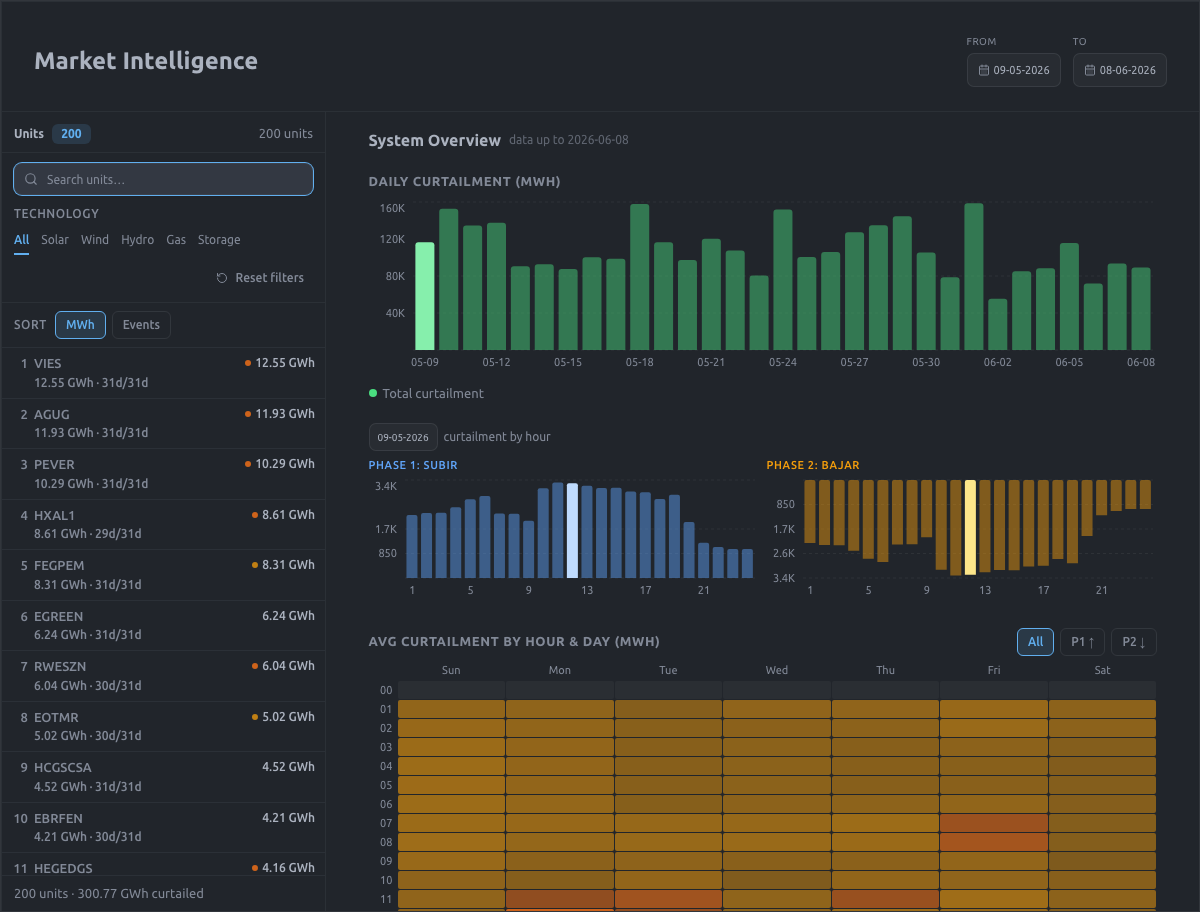
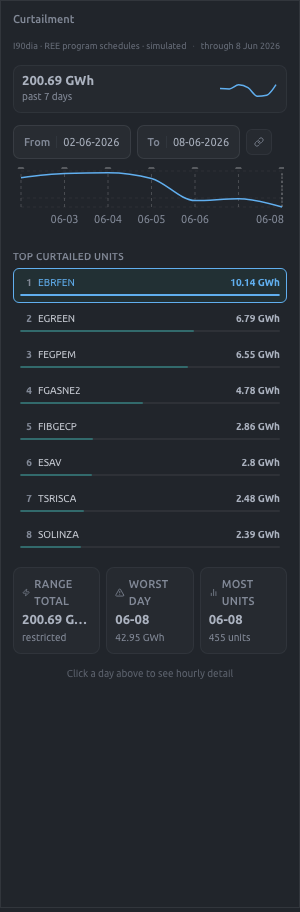
Curtailment View is designed to help teams understand where generation output is affected by restrictions. Users can review heatmaps, date ranges, top curtailed units, and unit-specific production or curtailment profiles.
Market Intelligence gives teams a workspace for reviewing unit-level market behavior, curtailment patterns, and temporal signals. It combines ranked unit lists, filters, charts, heatmaps, and calendars so users can move from a system-wide view to a specific asset.
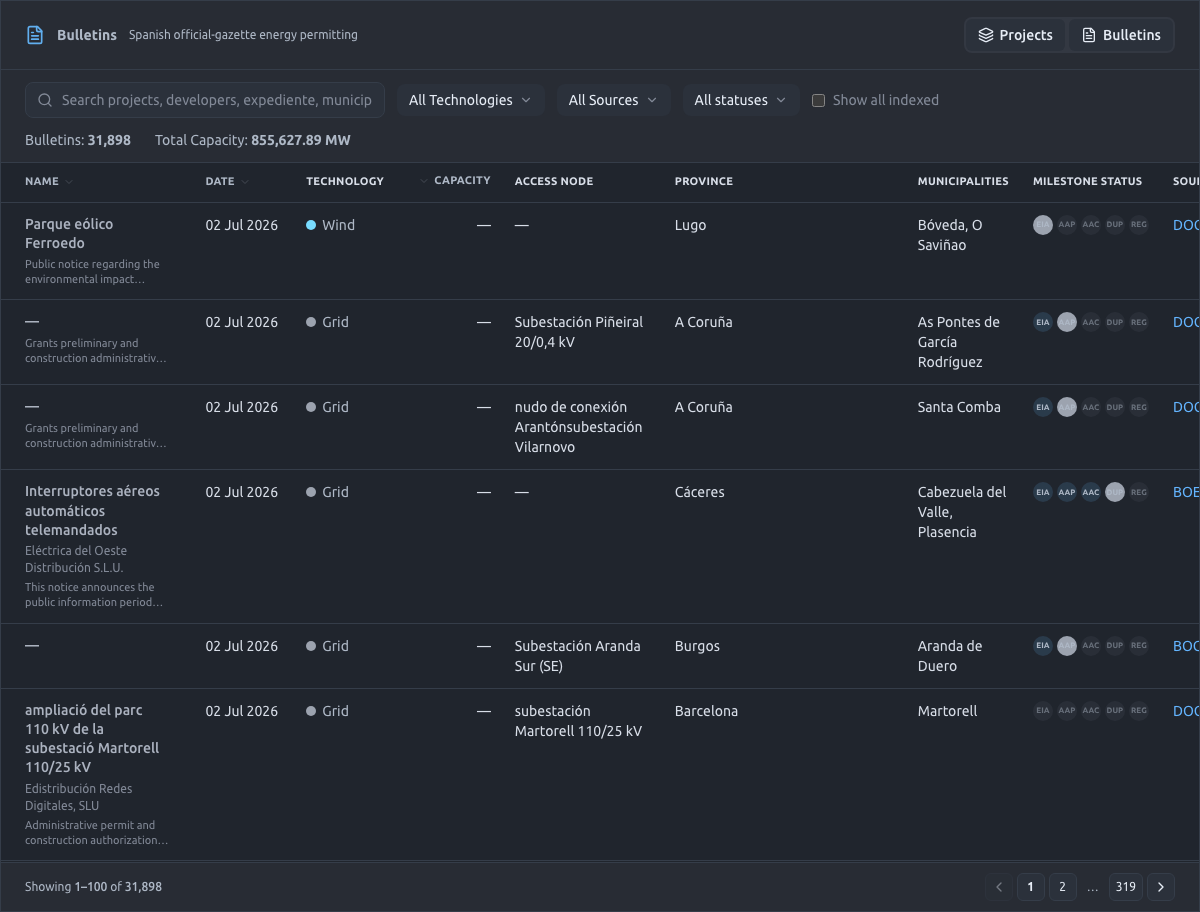
Bulletins turns official-gazette energy publications into a searchable analysis workspace. Teams can review project rollups, milestone status, capacity information, source links, and the publication ledger behind each permitting signal.
The two-minute overview shows how a user moves from map filters and layers to asset search, 3D and Catastro context, and selected asset inspectors.
Monthly Flex supports focused work. Annual access is for teams that use Iberian grid intelligence as part of their weekly development, investment, or advisory process.
Prediction modules and tailored Capacity and Curtailment studies are reviewed in a walkthrough.
eRoots Map is a digital twin of the Iberian power grid that combines physical grid assets, generation, substations, lines, capacity indicators, curtailment signals, market intelligence, Catastro context, and permitting bulletins.
It is built for energy developers, storage teams, data-center teams, consultants, investors, and grid-analysis teams that need location-specific evidence for energy decisions.
Yes. Users can search and select generation assets, substations, transmission or distribution lines, and cadastral parcels. The inspector shows the relevant technical and contextual details for the selected item.
Yes. Capacity View supports connection-capacity screening, while Curtailment View helps identify restriction exposure across regions and individual units.
Yes. At local zoom levels, users can activate Catastro parcel boundaries and inspect parcel references with links to official Catastro records.
The platform combines several technical datasets and workflows. A guided demo lets eRoots show the workspaces that match each team's geography, asset type, and decision process.