VeraGrid Feature Spotlight: Contingency Analysis
February 26, 2026
Welcome back to the VeraGrid Feature Spotlight series. In each installment, we explore one of the core capabilities of VeraGrid, our open-source platform for modern power system analysis. This time, we focus on Contingency Analysis, one of the key steps in moving from a solved base case to a meaningful security assessment of the grid.
Looking beyond the base case
A conventional power flow tells us how the system behaves under normal operating conditions. But a secure grid cannot be assessed only in its intact state. Engineers also need to know what happens when credible outages occur, whether the loss of a line, a transformer, or a generator.
That is the purpose of contingency analysis. Rather than studying just the base case, it evaluates how the network behaves after such events and checks whether limits are still respected. In most practical studies, this means verifying N-1 security, where the system should remain within acceptable operating bounds after any single outage. Typical issues of interest include thermal overloads, as well as voltage and angle violations.
Two complementary methods
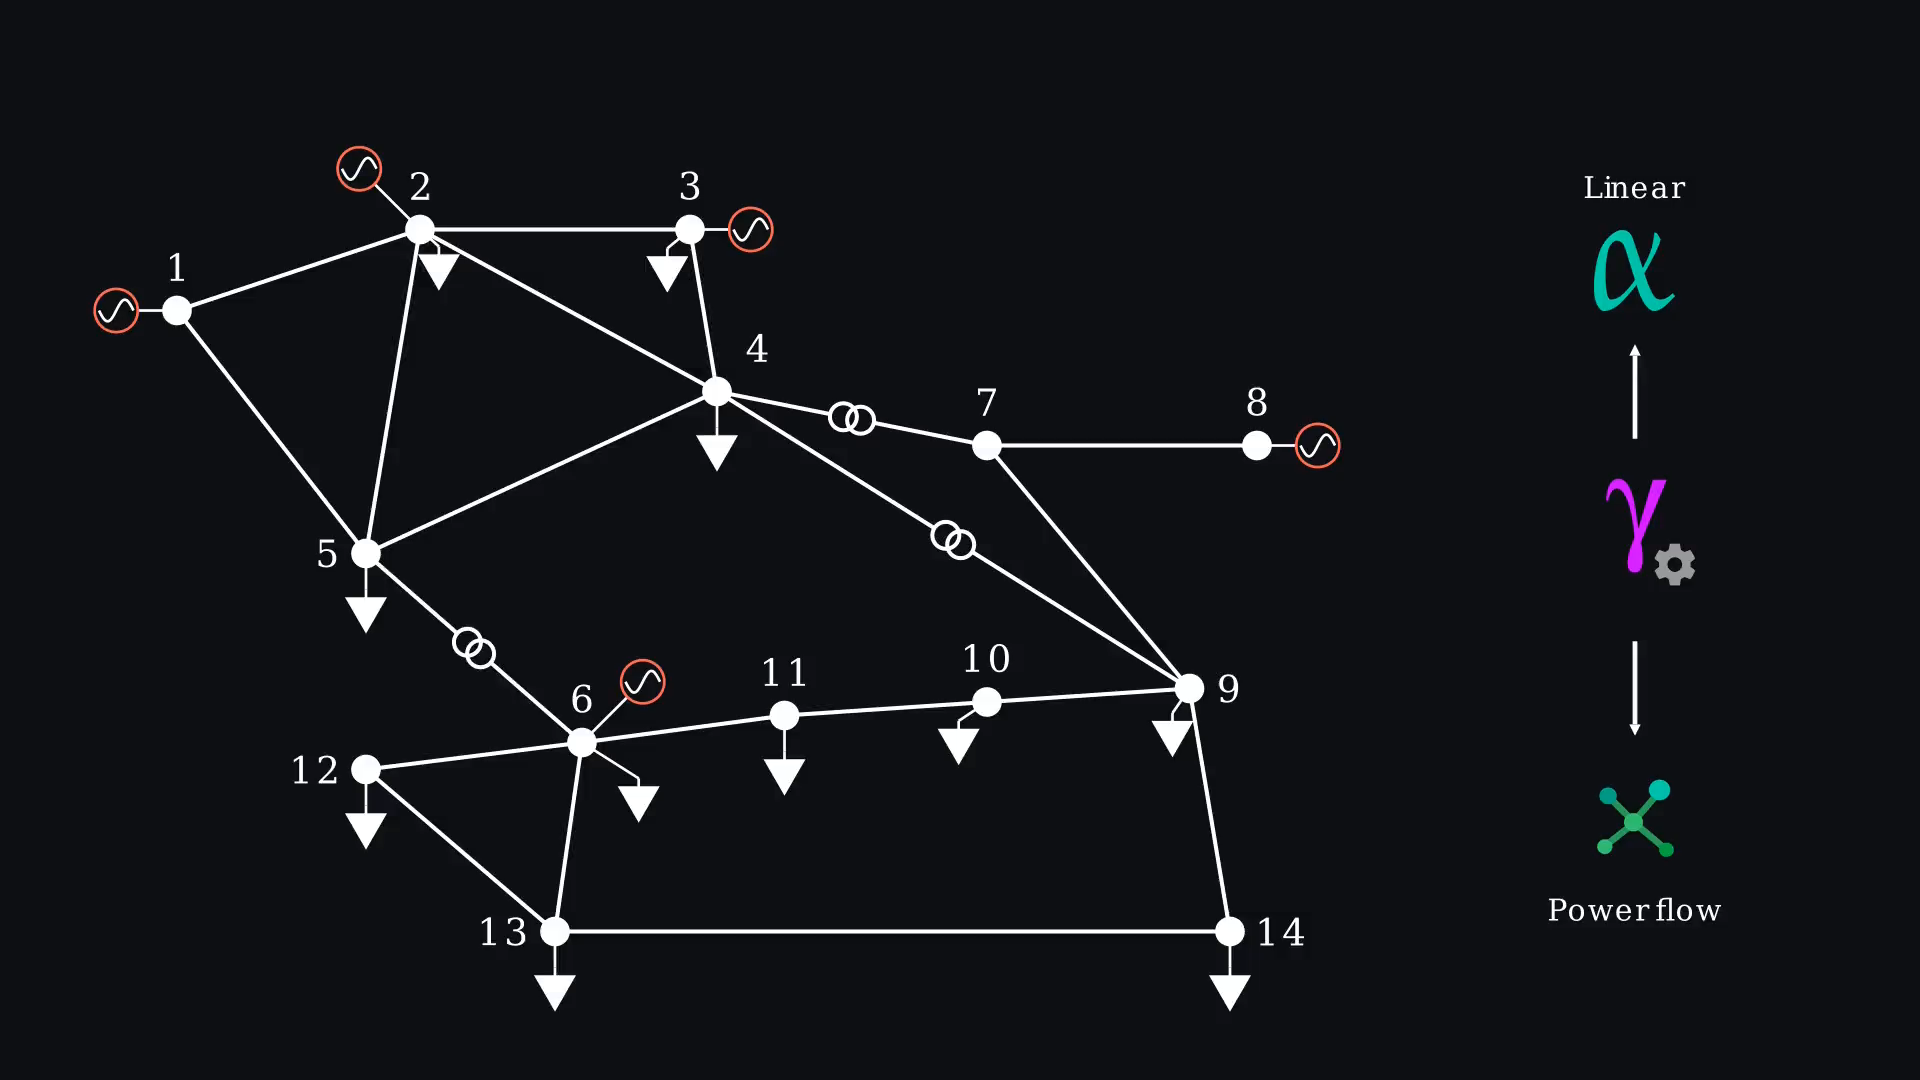
The video presents two complementary ways of carrying out contingency studies in VeraGrid.
The first is the power-flow-based method, in which a full power flow is solved for each outage. This is the standard approach when detailed post-contingency results are needed, especially when voltage and reactive power effects play an important role. The second is the linear method, which uses a DC or sensitivity-based approximation to estimate post-contingency flows more quickly. This makes it well suited for screening large contingency sets and identifying the most critical cases before applying a full AC analysis. The video also notes that, because of the theory behind linear analysis, a maximum of two simultaneous contingencies can be studied at once with this approach.
Defining contingency scenarios
One of the concepts introduced in the episode is the way VeraGrid structures contingencies into groups. Each group represents a scenario, and each scenario can contain one or several events. This allows users to define both simple single outages and more complex combined cases within the same framework.
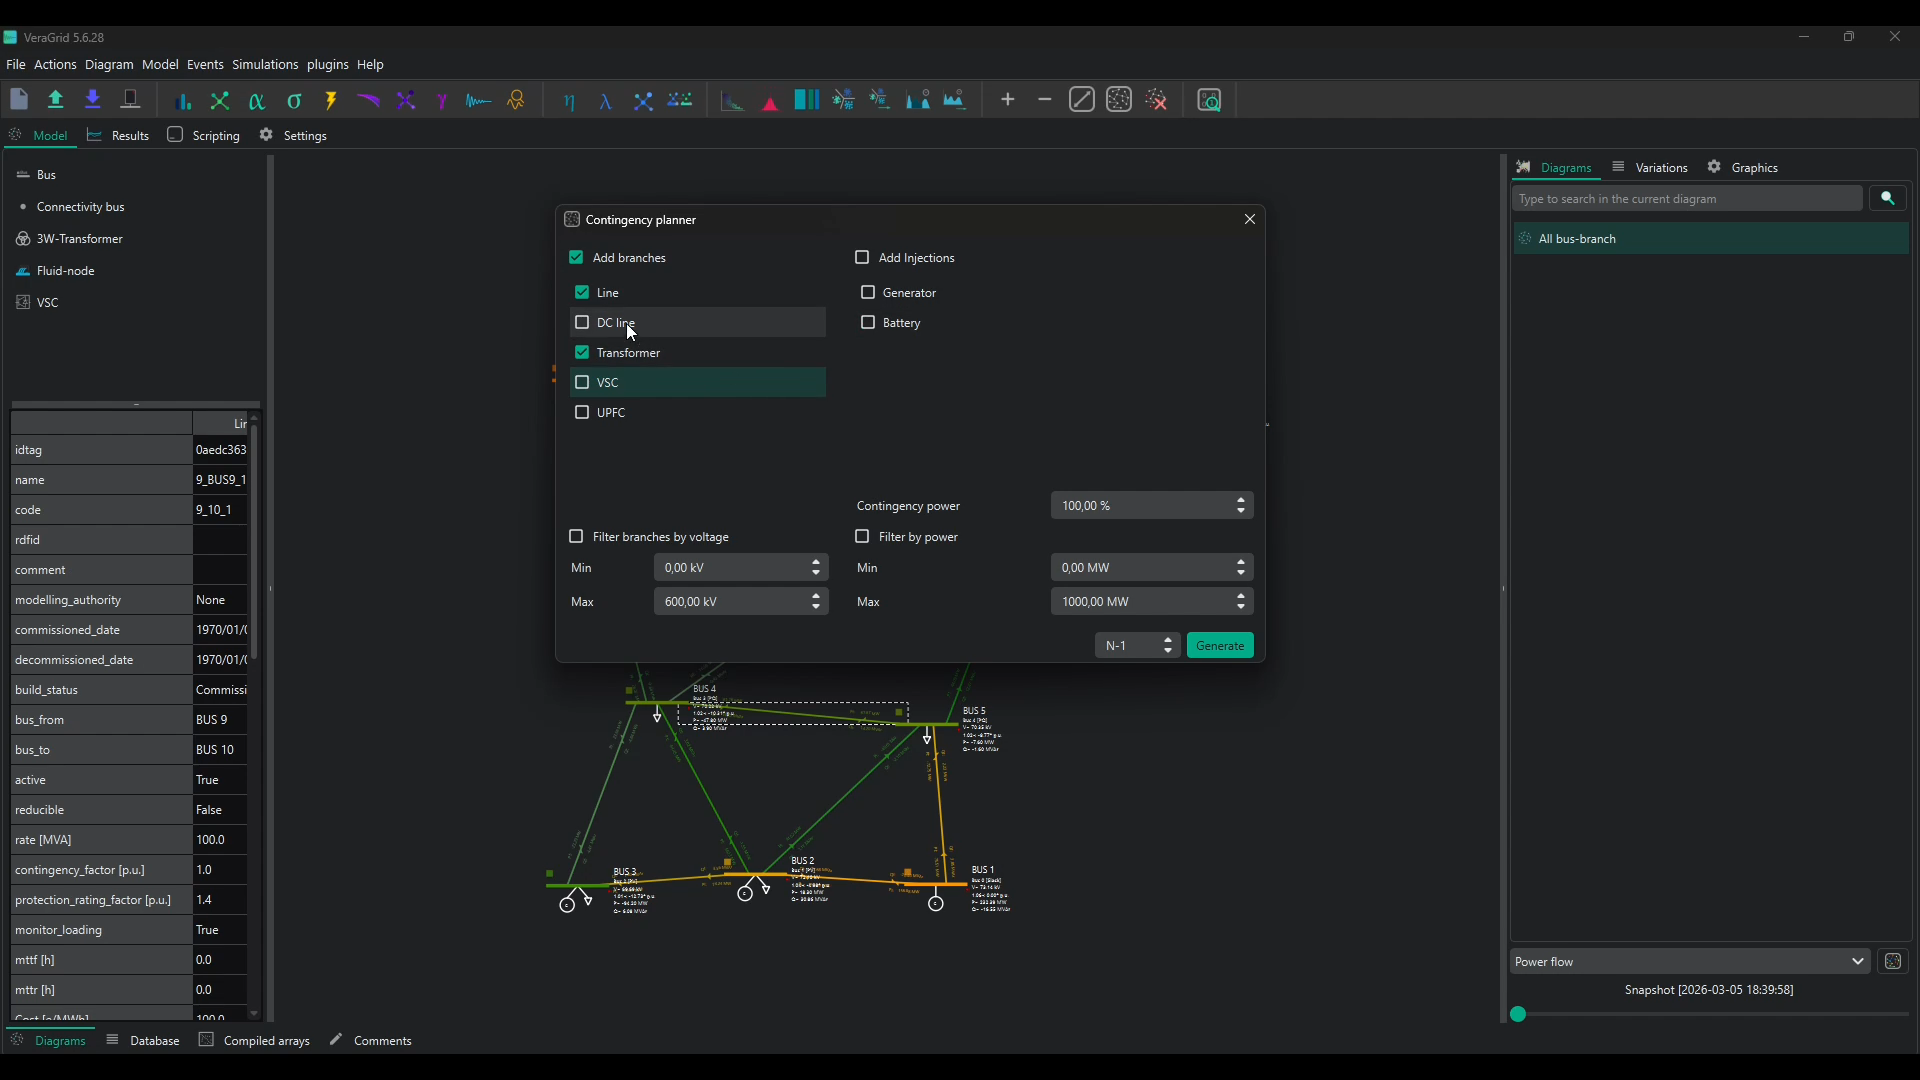
The walkthrough shows both manual and automated ways of building this database. Individual contingencies can be created directly from selected elements in the schematic, but larger studies benefit from automatic initialization. In the example, VeraGrid generates all N-1 line and transformer contingencies in one step. The same approach can be extended to injections such as generators or batteries, and filtering can be applied by voltage level or power rating to focus on the relevant subset of the system.
Running the study
For the practical demonstration, the episode returns to the IEEE-14-bus system used in earlier videos. After solving the base power flow, the contingency database is defined and the study settings are selected. The user can choose between the linear and power-flow-based methods, activate SRAP to adjust generation when a violation is identified, and apply a deadband so that only contingencies with a sufficiently notable impact are included in the report.
The video then compares contingency results under different dispatch assumptions. When run from the existing dispatch in the model, some branches appear overloaded. When the study is instead based on an OPF dispatch, the results improve significantly and the overloads are removed. This illustrates an important point: contingency performance depends not only on network topology, but also on how the system is being operated.
Automating the workflow
The final part of the video shows how the same process can be automated through scripting. VeraGrid allows users to define contingencies programmatically, either by iterating through relevant branch elements or by calling the contingency wizard directly from code. The script shown in the episode runs the OPF, then compares both linear and nonlinear power flow and contingency results, making it easier to understand how the different methods relate and where deviations appear.