The €26 Million / Year Bill for TSOs
How Disconnected Software Costs a Typical TSO €26+ Million Every Year, Broken Down
May 8, 2026
To meet national climate targets, the world will need to add or replace 80 million kilometres of power lines by 2040, an amount equal to the entire grid that exists today. The world is about to spend more on the electricity grid than on almost any other piece of physical infrastructure on the planet.
Through 2030, the increase in global electricity consumption will be the equivalent of adding more than two European Unions of demand on top of what the system already carries.
That is the landscape today.
And beneath that landscape there is a hidden story, an elephant in the room. It is the story of how Transmission System Operators plan the grid.
The tools their engineers use, the data they migrate by hand, the simulations they run several times because nothing talks to anything else. The story of an entire profession working with a digital toolkit that was designed for a world that no longer exists.
This article is about putting a number on this question:
What does fragmented planning software actually cost the typical TSO every year, in plain euros and plain hours?
The scenario in numbers
- Across Europe and the United States alone, more than 4,000 gigawatts of projects are stalled in grid connection queues.
- Across Europe alone, 1.7 terawatts of renewable and hybrid projects are frozen on a waiting list spanning 16 countries: six times Germany's total installed generation capacity.
- In the United States, the queue stands at 2,600 GW, with median wait times now approaching five years.
While those projects wait, the existing system is leaking value. Aurora Energy Research found that renewable curtailment cost Europe €8.9 billion in 2024, with 72 TWh of mostly clean electricity wasted, roughly equivalent to Austria's entire annual consumption, written off because the grid could not absorb it.
EU congestion costs reached €4.3 billion in 2024, and Eurelectric estimates that connection backlogs could become a €9 billion annual drag on the European economy if unresolved.
All these are symptoms of a congested and outdated global grid. And behind these figures, TSO planning teams are trying to model the future of a system that is changing faster than they can keep up with, because the tools they use were never designed for this pace and scenario.
A structural problem hiding in plain sight: the disconnected toolset
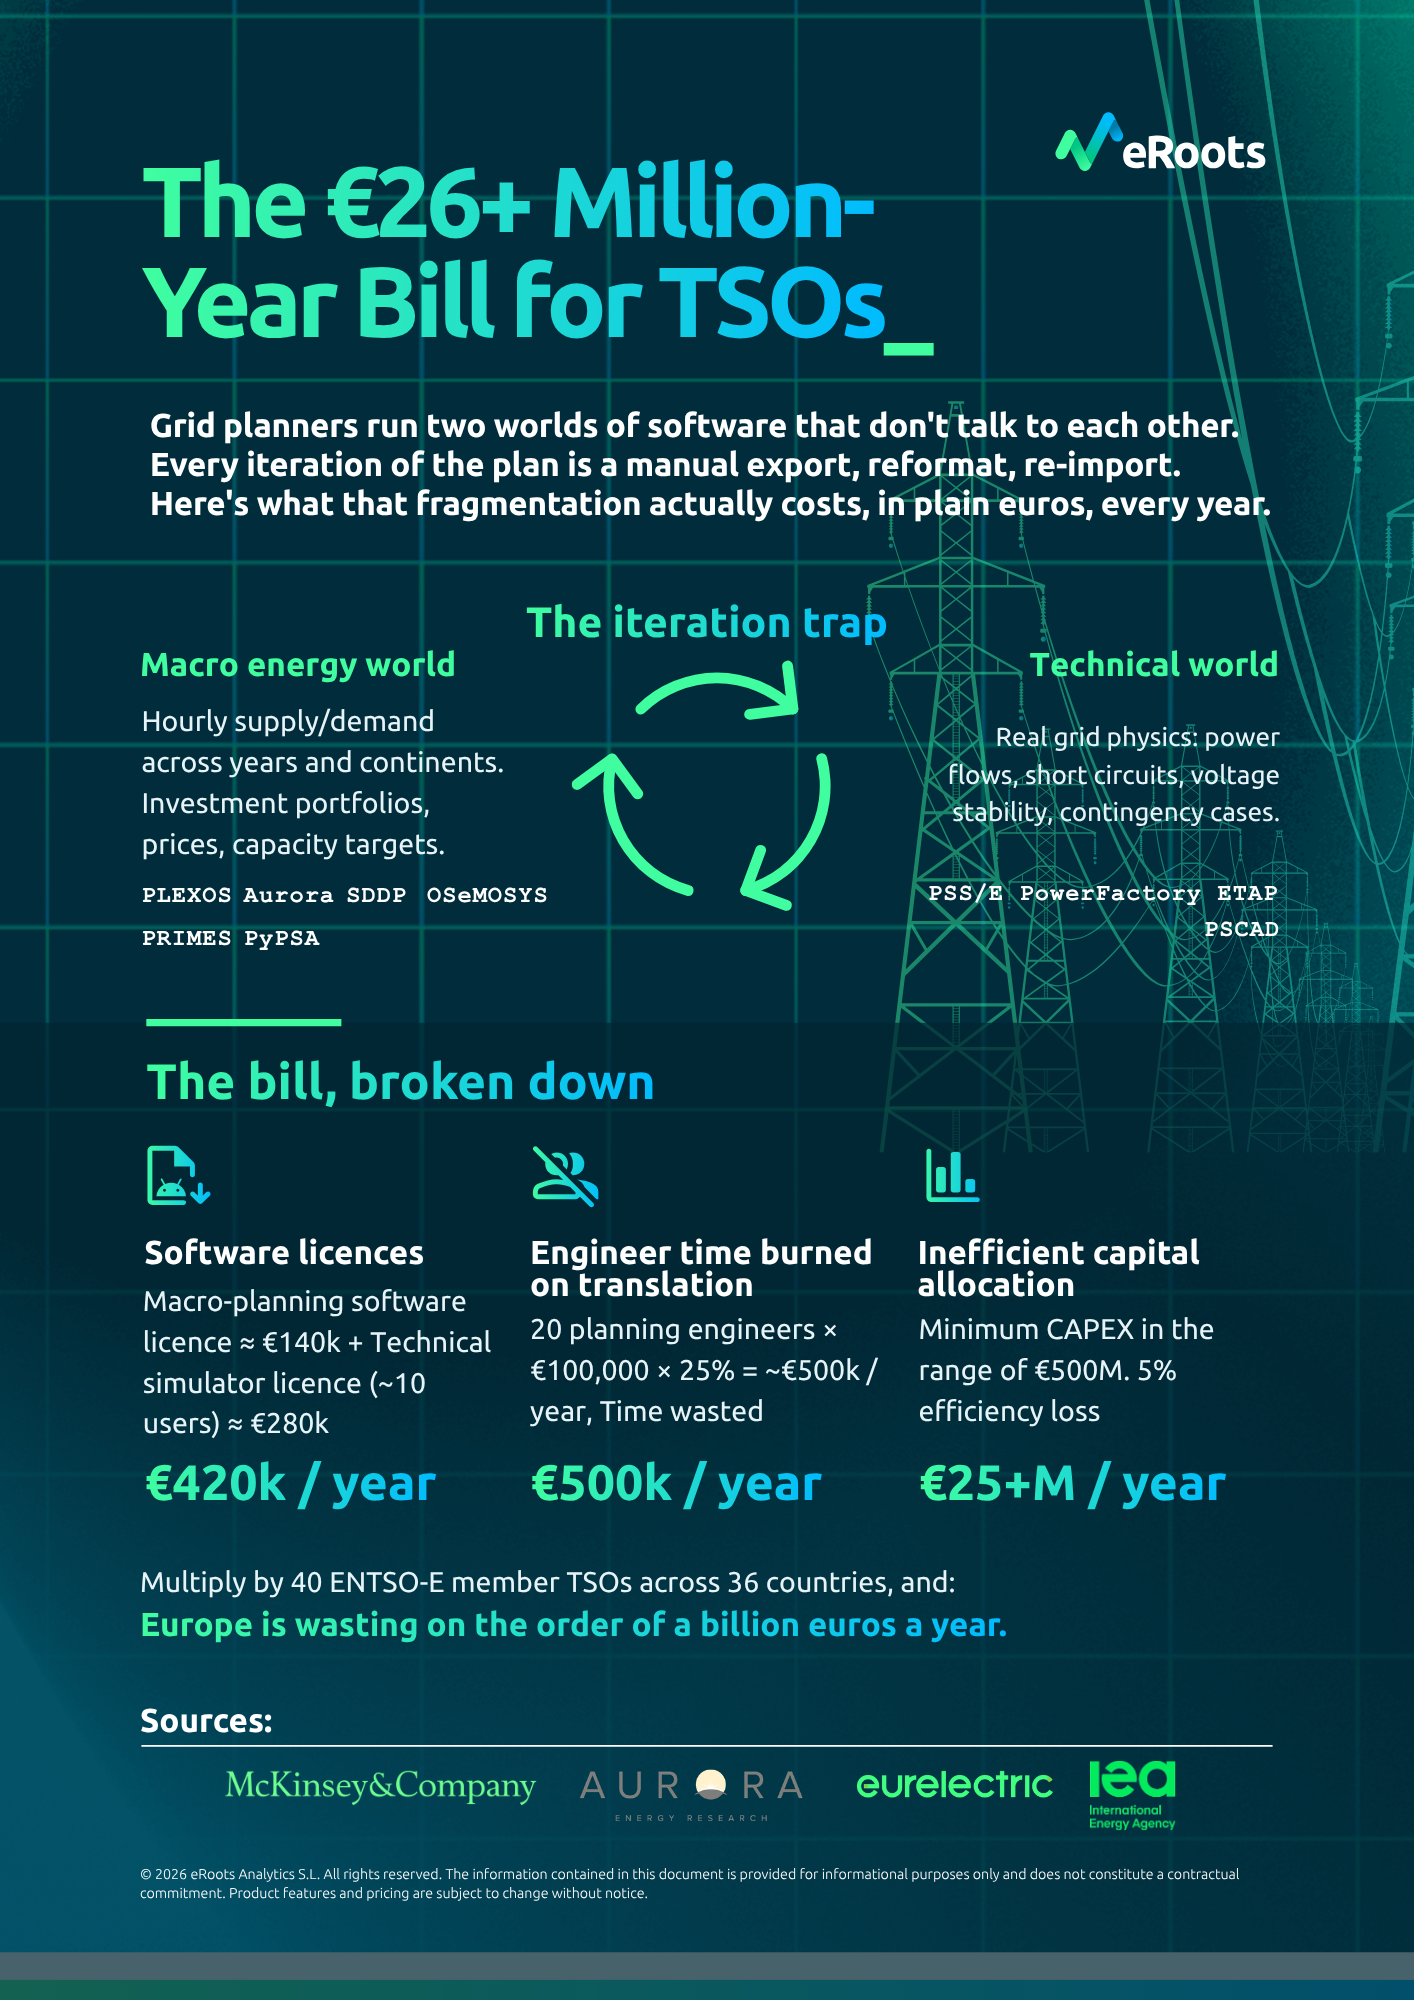
To plan for the next decade, a grid planner today typically uses two entirely separate worlds of software that do not talk to each other.
The first is the macro world. Tools like PLEXOS, Aurora, PSR's SDDP, OSeMOSYS, PRIMES, or PyPSA simulate hourly power supply and demand across years and continents. They optimise investment portfolios, project market prices, and tell you where capacity should be built in aggregate. Some do not consider electrical power systems at all and others model the power system by considering the lines' capacity without consideration of electrical technical constraints.
The second is the electrical world. Tools like PSS/E, PowerFactory, ETAP, or NEPLAN simulate the actual physics of the grid: power flows, short circuits, voltage stability, contingency scenarios. They tell you whether a particular plan is electrically feasible on the actual lines and substations.
Both worlds are essential. Both have to be right. But they are disconnected.
So this is what a planner does:
- They build a strategic scenario in the macro tool, a five-year hourly simulation of the future grid.
- Then they manually export that data, de-group it, re-aggregate it, reformat it, and re-import it into the technical simulation tool, mapping every aggregated figure onto specific lines, substations, and nodes.
- Then they run the electrical simulation.
And then, inevitably, the simulation fails. The macro plan that looked beautiful in the market model turns out to be physically impossible in the real grid.
So the planner adjusts assumptions, exports again, transforms again, imports again, and runs again.
This is the loop that engineers inside TSOs sometimes call the iteration trap. A structural feature of the toolchain that operators around the world have inherited.
The planners of the energy transition need to drive at the speed of the energy transition with the gearbox of 1990s software architecture.
So how much does that actually cost?
Adding up the €26 million bill
Let us walk through it the way a CFO would.
For a typical mid-sized TSO with around 100 grid-planning engineers. A profile that fits operators in Spain, Italy, Belgium, the Netherlands, Czechia, Portugal, and dozens of comparable systems across the OECD.
Layer 1. Software licences
Enterprise planning software at a TSO is typically licensed organisation-wide rather than per seat, with a small number of named users.
Public procurement records offer a useful anchor: Latvia's TSO signed a five-year PLEXOS contract worth around €700,000, or roughly €140,000 per year for the entire organisation.
Technical simulators in the PSS/E or PowerFactory class follow a similar enterprise licensing model, with a typical TSO supporting around 10 active named users at a total annual cost in the region of €280,000 per year.
Layer 1 Calculation
Macro-planning software licence ≈ €140k
+ Technical simulator licence (~10 users) ≈ €280k
≈ €420k / year
Just to keep the tools turned on.
Less than half a million euros a year on licences. It may look small on a TSO budget. So small, in fact, that it tempts boards to dismiss the whole problem. But licences are by far the cheapest part of this bill.
Layer 2. Engineer time burned on translation
Forrester's 2024 research on knowledge-worker productivity found that professionals lose 23% of their weekly time toggling between disconnected applications.
Harvard Business Review documented that the average digital worker spends roughly four hours a week, around 9% of total work time, simply reorienting after switching tools. For project-heavy professionals working across multiple disconnected platforms, the figure climbs higher still.
For a grid-planning engineer, the equivalent of toggling is more painful: exporting CGMES files, transforming PSS/E raw data, re-aggregating for OSeMOSYS, manually mapping load profiles into PowerFactory cases, and hand-checking that nothing has drifted because of rounding, version mismatches, or silently overwritten inputs.
A senior power-systems engineer in Western Europe costs a TSO, fully loaded, in the region of €100,000 per year.
The number of these engineers actually running the planning toolchain inside a typical TSO is small: roughly 10 macro-planning users plus around 10 technical-simulator users. Call it 20 engineers who live inside the iteration loop.
If each of them loses 25% of their working time to data translation, reformatting, and the iteration cycle, the math is brutal. Twenty-five percent is only slightly above the 23% Forrester reports for general knowledge-worker toggling, which is reasonable: the iteration trap is more painful than ordinary app-switching, because every loop involves de-grouping, re-aggregating, and validating data between fundamentally different model structures.
Layer 2 Calculation
20 engineers × €100,000 × 25%
≈ €500k / year
Senior engineering time burned on data translation, reformatting, and iteration.
Running total: €420k + €500k ≈€1M / year
Half a million euros of senior engineering time, every year, absorbed by the friction between tools. Not invested in better grid plans, just spent on data plumbing.
And remember, this only counts the people who run the toolchain directly. The wider planning function around them, often another 80 to 100 people in a typical TSO, is slowed down indirectly by every iteration loop, every delayed simulation, every study that lands two weeks late. We are not even counting that here.
Layer 3. Capital allocated less efficiently than it could be
This is the layer that should keep TSO boards awake at night.
McKinsey's research on grid planning is unambiguous: utilities that move to integrated planning approaches, where the macro and technical views live in the same model, see up to 20% capital-efficiency gains and material reductions in reliability events.
One European operator that built a unified model spanning more than 10,000 grid variables reduced its capex by 10 to 30%, simply by being able to see the whole picture before committing capital.
For a typical mid-sized TSO, annual grid capital expenditure is in the range of €500 million to €1 billion. Even applying a deeply conservative 5% efficiency loss, a quarter of McKinsey's upper-bound figure, to a €500M annual capex programme:
Layer 3 Calculation
€500M annual capex × 5% inefficiency
≈ €25M / year
Capital deployed less efficiently than an integrated model would allow.
Running total: €420k + €500k + €25M ≈€26M / year
This is not money the TSO writes a cheque for. It is money it commits to investments that, with a clearer view of the whole system, would have gone somewhere better. It is the most invisible cost on the bill, and almost certainly the largest.
The full bill
Add the layers together, and the picture for a single typical TSO looks like this.
The Fragmented Toolset Bill, Per TSO
Annual total: ~€26 million
Every year. For a single mid-sized TSO. Hiding in plain sight.
And these are conservative numbers. We are using the lower end of every external benchmark: McKinsey's 5% instead of the 10 to 30% capex improvement observed in integrated planning cases; and a mid-sized-TSO profile rather than the largest national operators.
ENTSO-E alone has 40 member TSOs across 36 countries.
Apply even a fraction of this bill across the membership, and Europe is wasting on the order of a billion euros a year.
Globally, the figure is multiples of that. Hundreds of TSOs, each running their own version of the same fragmented toolchain, each absorbing their own version of the same invisible bill.
What integrated planning platforms unlock
The Fragmented Toolset Bill is invisible. But it is real. And once you start counting it, you cannot really stop.
The good news is that this is one of the most fixable problems in the entire energy transition. Cables take a decade to permit, but software architectures can change in a year.
Planners are starting to work in unified environments where the macro scenario and the electrical detail live in the same model. Where running a contingency study on a 2030 investment portfolio takes minutes instead of months.
Where the same analysis that explores hosting capacity at one substation can also drive a country-wide market simulation, because the data structures are continuous from one to the other.
This is what a digital twin of the grid is supposed to be: a working, integrated, agile model.
The tools to do this exist now. Some are commercial. Some are open-source. The TSO community has begun, quietly, to build them, collaboratively, transparently, with academia, with consultancies, and with the engineers who actually feel the daily pain of the iteration trap.
VeraGrid, the open-source engine eRoots has helped develop with partners including REE and CITCEA-UPC, is one such effort, and there are others.
When a TSO removes the iteration trap, three things happen, and they happen together:
- Studies that used to take weeks take days.
- Engineers stop being data-pipeline workers and start being engineers again.
- The organisation gains the ability to re-plan, respond, and adapt to a transition that is no longer linear.
That is what integrated planning unlocks.
The VeraGrid platform is ready, free, and available here.
Joan Puyol i Bosch, eRoots
Sources
International Energy Agency
- IEA, Electricity 2026
- IEA, Electricity Grids and Secure Energy Transitions (2023)
- IEA, Unlocking Smart Grid Opportunities in Emerging Markets and Developing Economies
- IEA, World Energy Investment 2025
- IEA, Breakthrough Agenda Report 2025: Power
ENTSO-E and European Commission
- ENTSO-E, New Ten-Year Network Development Plan highlights power transmission and storage needs to meet the Energy Transition targets
- European Commission, European grids
Industry analysis and consultancies
- Clean Energy Wire, Q&A: EU Grid Package
- Eurelectric, From Backlog to Breakthrough: Managing Connection Queues in Distribution Networks
- Beyond Fossil Fuels, Outdated grid planning and weak governance stalling Europe's transition away from fossil fuels
- McKinsey, Grid planning under uncertainty: investing for the energy transition
- McKinsey, How grid operators can integrate the coming wave of renewable energy
- McKinsey, The new imperative for grid operators
Knowledge-worker productivity research
- Harvard Business Review, How Much Time and Energy Do We Waste Toggling Between Applications?
- Forrester, The Cost of Tool Fragmentation (2024, paywalled)