eRoots Map Now Shows Past Curtailment
March 17, 2026
Curtailment has become a central concern for developers, asset owners, and market participants in Spain. It affects project economics, shapes siting decisions, and increasingly influences how opportunities are assessed across the peninsula. Yet, despite its importance, getting a clear view of what is happening has often meant working through scattered files, checking unit by unit, and spending time assembling a picture that should be easier to see.
That is exactly the gap we wanted to address.
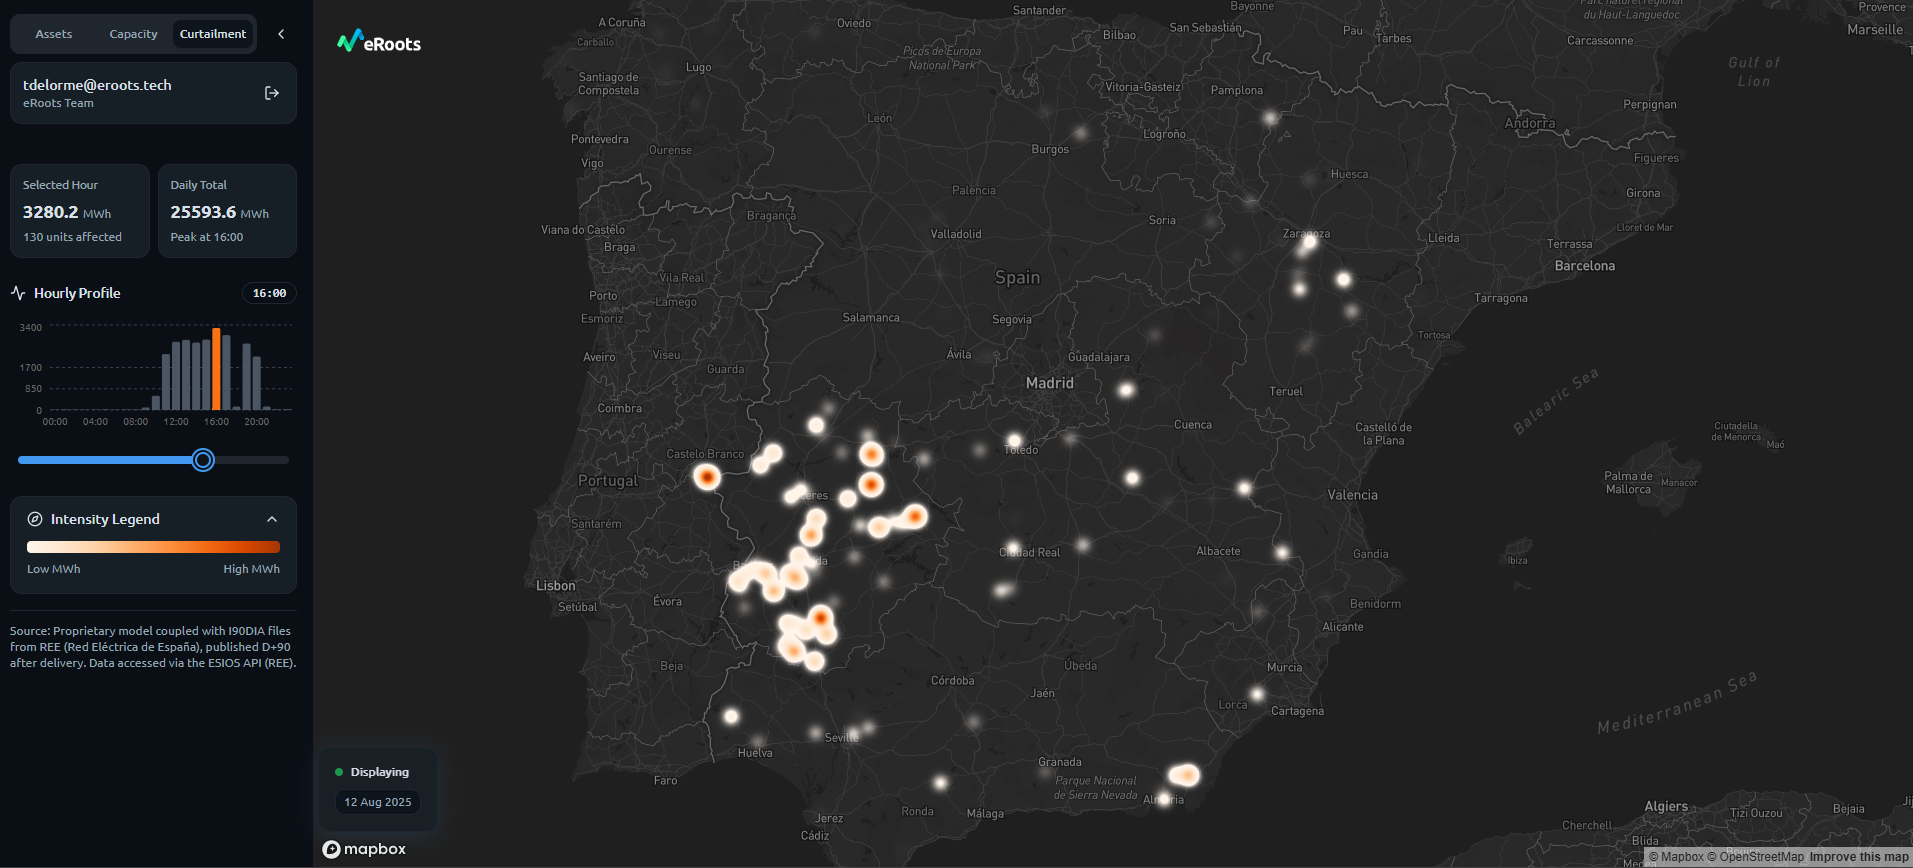
Our map now includes curtailment visibility at unit level, with hourly resolution, so users can understand what is happening without having to manually process multiple sources. Instead of guessing or stitching information together by hand, it is now possible to see the pattern directly.
Users can identify which units were curtailed and by how much. They can see where curtailment hotspots are concentrated across the peninsula. They can also follow how curtailment changes hour by hour throughout the day, which is often where the real operational story begins to emerge.
This functionality is powered by REE's I90DIA settlement files, which we process daily through our proprietary model and display directly in the map. The result is a clearer and faster way to work with information that has historically been difficult to interpret in a practical, system-wide way.
For many in the market, this kind of visibility has been missing for a long time. Developers want to understand how curtailment is affecting specific areas before advancing a project. Market participants want a better sense of where constraints are appearing and how those patterns are evolving. In both cases, the need is the same: a more direct way to see what is happening on the grid.
Next Step: Scenario-Based Prediction
This is also only the beginning.
The next step is scenario-based curtailment forecasting. The goal is to move from observing where curtailment has occurred to testing how it could evolve under future conditions. Users will be able to define their own assumptions, explore different system conditions, and assess how curtailment may shift across units, zones, and hours.
That matters because curtailment is not only a historical signal. It is also an indicator of where future constraints may emerge, where risk may concentrate, and where the economics of a project may become more complex than they appear at first glance.
A better understanding of curtailment starts with better visibility. From there, the real value comes from being able to ask forward-looking questions and test them with the right level of detail.
If you want to explore curtailment in your area of interest, or see what our forecasts suggest under your own assumptions, get in touch and check out a preview of the map: map.eroots.tech.